Gather round, kids! Your teacher’s going to tell you a story about the historical fluctuations in his compensation package!
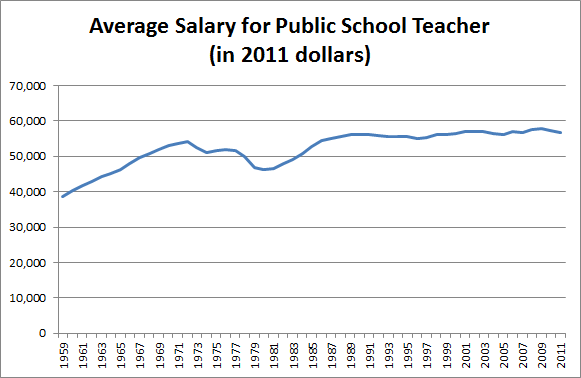
If we just adjust for inflation, teacher salaries look pretty flat. They climbed throughout the ’60s, dipped in the ’70s (not keeping pace with rapid inflation), rebounded in the ’80s, and haven’t changed much since.
But “flat adjusted for inflation” doesn’t necessarily mean “flat.” Maybe other salaries have gone up, even after adjusting for inflation, while teacher pay has stayed the same. In that case, teacher pay is falling behind.
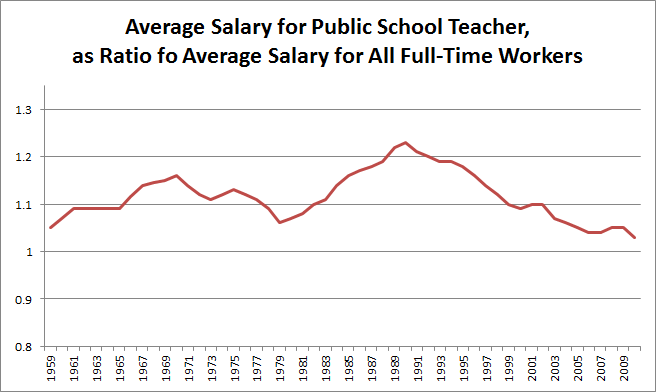
As a matter of fact, that’s what seems to be happening:
 The average teacher makes more than the average full-time worker. (That’s partly because almost all teachers have college degrees; not all workers do.) How much more? Well, the teaching bonus has fluctuated from 5% in 1959 all the way up to a peak of 23% in 1990. Teaching was a pretty well-paid gig back then.
It’s stumbled since. The 1990’s and 2000’s were comparatively unkind to teachers, who now make just 3% more than the average worker.
Source: National Center for Education Statistics
Caveats: From 1959 to 1969, the NCES only has data for alternating years. I filled in the gap by averaging the two adjacent years. (For example, the ’64 numbers are just an average of the ’63 and ’65 numbers.)


How about showing the data for teachers vs all college grads?
The NCES doesn’t give that comparison, but I’ll try to post some Bureau of Labor Statistics data on that question soon. It’s a worthwhile comparison.
Ah, by the way, I forgot to mention: the OECD says that currently, the average American teacher makes about 70% as much as the average American college grad.
Some of this is because the teacher works a shorter year. But the OECD also says that teachers work about 1900 hours per year, which is close to the standard 2000-hour workyear (although perhaps the average college grad works well over 2000 hours–I haven’t found figures).
Since a VERY large component of teacher compensation is benefits and pension- perhaps that value should be added to your analyses?
Unfortunately, the NCES doesn’t provide that data, and I haven’t had much luck finding reliable national-level data elsewhere.
It’s certainly possible that rises in pensions have offset the drop in salaries (compared with other professions). Teachers unions became much more politically active starting around the 1960s.
In my last public school job, the union sacrificed new teachers’ pensions in order to keep up with increasing costs of health insurance. Teachers may not be getting pensions anymore, or at the rate of their predecessors (although I bet older teachers are still taken care of).
At the college where I work, the average salary for full professors is about $68,000 and the total compensation package is, on average, about $76,000 (we just got small raises and these figures were provided in a breakdown of funding priorities). So, if by VERY, you mean 10.5% of total compensation…then…sure
Please add details: the $8,000 difference includes your health care (and health care money they would pay for your kids if you have them), retirement plan contribution/matching, discounts for your kids to go to same college, 1/2 taxes paid by the college (as self employed person, I pay the whole Social Security amount – so I consider it a benefit if someone pays half), unemployment insurance, etc ? Question: Do you work 2000 hours per year ? Get a month off at Christmas ? 3 Months Summer ?
John, I have some specific nitpicks–for example, pretty much everyone other than the self-employed gets the employer contribution to payroll tax, so it’s not usually classified as a benefit). Also, not knowing the nature of sciencemalcontent’s job (public university? private college?), it’s quite possible that it doesn’t include some of the benefits you mention.
That said, I agree with you that teaching (including at the university level) is structured very different from other jobs. There’s summer break and tenure. There are lower salaries. There are generally good benefits (though wwndtd’s example and others paint a slightly more complicated picture). There’s an argument to be made that the conditions are more strenuous than the average white-collar work, especially in K-12, and particularly K-8. (Try asking a middle school teacher for some stories about her workplace, or asking an elementary school teacher how often he gets to use the bathroom.) It’s also very rewarding work, which counts for something.
Thus, when asking “Is teaching well-compensated or under-compensated?” there’s a lot of factors to weigh, on both sides of the scale.
That’s why I prefer historical and international comparisons, as opposed to direct teaching-vs.-other-jobs comparisons. Hence, the graphs above. There’s a lot of the story they leave out, but it seems plausible to suggest, “If teachers in the US make more/less than teachers in other countries, and if they make more/less than their predecessors in past decades did, then they are well-/under-compensated.”
To answer some of John’s (Dec 5 post) questions. I work at a private college. I pay 10% of my salary toward my retirement while my college pays a matching 5% (down from 7.5% which is what it was when I was hired). They contribute to health care premiums, etc. but my share of this has increased over the years (would have to go dig up old pay stubs to quantify this). My college does the normal things that an ethical employer does and these add up to the $8000 difference between “salary” and “total compensation”. My point was that the “VERY large component of teacher compensation [that] is benefits and pension” mentioned by taugh40 all depends on how you define “VERY”.
Further details you may find interesting (and this is one faculty member at one college so they do not have the generality of Ben Orlin’s data). I have no children so I do not benefit from any tuition remission programs. As for the “month off at Christmas” and the “3 months summer”. I am working through the holidays writing papers and guiding three search committees for new faculty. We are expected to do research during the summer to satisfy the criteria for promotion and tenure and we do not receive compensation for that time unless we write a grant that provides summer support. And if we do not devote ourselves to maintaining scholarly productivity, we risk not earning tenure, tenure being something that is earned, not a gift or an entitlement. We are also expected to not have a second job during that time as the college is our primary employer (there are actually rules about this in the faculty handbook).
I once kept track of my time investment at my job, in 15 minute increments, like a lawyer does. It became too depressing that I could not sustain it for too long when I discovered that I work between 60 and 80 hours a week. During the “3 month summer’ that you think I have off, I often find myself working 12-14 hour days, 6-7 days a week because I am in the field and that is when you can get your field work done. By my calculation, I probably work around 3500 hours per year.
When I see comments like those from John, it strikes me that the culture outside of academe thinks teachers at all levels are a bunch of unionized freeloaders (no union at my college) while the truth of the matter is that we work hard at our jobs and are committed to them which is why compensation is low compared to workload. And I work in the relatively relaxed world of higher education. I could not handle the load bourne by K-12 teachers. I would crack under the pressure.
That said, I like my job and live a comfortable life but part of that was a series of conscious decisions to live life more simply (taking a lower-paying job at a liberal arts college where the work is more personally satisfying; not having children; etc.).
In Massachusetts, the state that I am familiar with, teachers pay 11 percent of their salary toward their pension, the local school district pays nothing, and the state pays 0.6% of the teacher’s salary. Teachers do not contribute to Social Security, and earn no Social Security benefits.
So, maybe they get a decent pension, but they’ve paid for over 95% of it out of their own pocket, and their employer has paid next to nothing. So, calling it a benefit is a bit of a stretch.
Source: http://www.malden.massteacher.org/files/Pension-FAQ3.pdf
See pg. 4.
I notice that the dip in salary around 1980 coincides with the point in time in a later post, around 1981, when the fewest number of teachers said they would teach again.
Have you ever considered publishing an ebook or guest authoring on other websites?
I have a blog based on the same subjects you discuss and would really
like to have you share some stories/information. I know my readers would value
your work. If you’re even remotely interested,
feel free to shoot me an e mail.
Thanks for the marvelous posting! I really enjoyed reading it, you happen to be a
great author.I will always bookmark your blog and will come back sometime soon. I want to encourage that you continue your great work, have a nice afternoon!
I enjoyed visiting your webiste. I leave comments rarely, but
you definately up deserve a thumbs!
[…] part was conveniently ignored as evidenced by the fact that average teacher salaries have barely budged since the 1980s. What has proliferated instead has been intensive evaluation systems that tie […]